NetBrain Next-Gen is the world’s most adopted no-code network automation platform that requires no programming to transform your key operational workflows into automated execution. By transforming your Troubleshooting, Change Management, and Network Assessment workflows at scale, Enterprises and MSPs realize fewer disruptions, lower costs, reduced remediation times, and lower operational risk. Built on our portfolio of patents, NetBrain Next-Gen understands all of your hybrid network’s devices, its topology, real-time traffic flows, and desired behaviors. By maintaining those behaviors, network operations are closely aligned with the business itself.
The Value of Network Intent
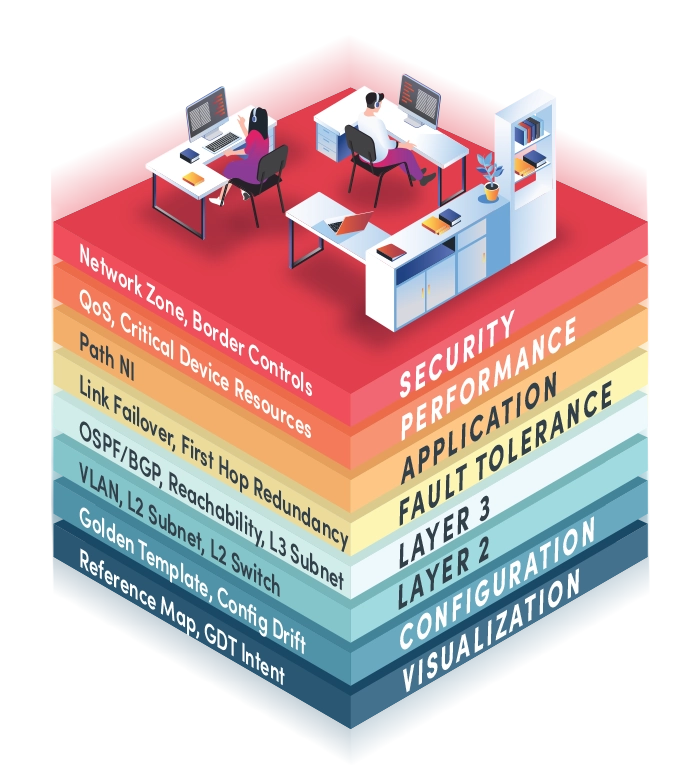
Network Intents are the behaviors needed by the business leaders, enterprise architects, security practitioners and all of the infrastructure designers translated into the network conditions that IT must deliver. Intents unify IT by providing a single place to perform service management. As more operation teams use more intents, the value increases, and you address more business needs.
Unlimited Integrations, Limitless Possibilities
Experience the power of NetBrain Next-Gen’s API integrations and build custom integrations seamlessly with no-code API capabilities.

01
4-Dimensional Live Digital Twin
The foundation of Next-Gen is its unique multi-dimensional live digital twin of complex hybrid networks. This advanced technology auto-discovers not only device details and network topology, but also connectivity, traffic flows, and network design intents of hybrid-cloud environments. The 4-D Digital Twin makes real-time contextual visibility and troubleshooting via real-time Dynamic Maps possible. It enables organizations to harness no-code network automation for auto-diagnosis, protected change, remediation, and assessment of the network without straining network resources. To guarantee timely analysis of network conditions, it’s updated as soon as network conditions change to ensure the success of an Intent-based automation system.

02
Decode Automation Engine
Enable any subject matter expert to capture their best practices to enable them to be shared across the organization and across the globe! The no-code visual parser unlocks no-code programmability on complex network problems. Enables network engineers familiar with visual parsing to parse configuration files, CLI commands, and SNMP output for automation problem resolutions. Manage your hybrid multi-vendor and multi-cloud network by converting network design knowledge into automated Intents—behaviors, policies, paths, and configurations—crucial to your business and validate their compliance and performance, using a no-code engine. Next-Gen captures network actions (ACLs, route comparisons, path failovers, etc.) using a visual parser and stores them as Intents without scripting or programming.

03
Replication Wizard
A new Replication Wizard makes it easy to replicate automation to the right devices across your hybrid-cloud network in minutes. It combines the template, decoding, auto intent, and adding to ADT into one wizard UI from a map intent or within the Intent Template tab in a common intent if not done on a map. The wizard then replicates Intents across your entire hybrid network.

04
Hybrid-Cloud
Networks are borderless, extending from traditional, on-prem infrastructure to SDN, SD-WAN, virtual, and public cloud for true end-to-end management. Display real-time configuration, topology, and condition of the network in dynamic, on-demand maps. Then, automate diagnostics using Intents right on any map or path. Export dynamic maps to Microsoft Visio or Word.

05
Continuous Assessment
Proactively assess risk and prevent downtime due to design and security issues, performance degradation, configuration drift, and human error by automating the continuous assessments that validate hundreds of pre-built or custom Intents. An early warning detection system provides scheduled enforcement of the network in support of business requirements.

06
Triggered Automation
Provides the ability to capture transient issues the moment they occur to left-shift initial diagnostic steps to the machine before any operator begins troubleshooting. Event-triggered automation begins diagnosing issues reported via your ITSM or NMS tool allowing less technical staff to solve more problems during first response.

07
Auto-Diagnosis and Self-Service Automation
Diagnose and perform individual tasks interactively when your subject-matter experts need to troubleshoot any issue. Spend more time resolving issues instead of running mundane preliminary steps. An interactive console provides dynamic real-time mapping technology, and bi-directional real-time path and path intent verifications. As engineers troubleshoot, Next-Gen intelligently records their diagnostic steps to create new shared automation.
Quickly diagnose network issues, share maps, and incident information, and collaborate with other people and teams with a simple chat conversation. Prompt end users to interactively provide input devices and other related data to execute intents and share important findings collaboratively with others. Speed troubleshooting, compliance tasks, and change management.

08
Intent-Based Automation Library
An Intent-Based Network Automation (IBNA) Library provides a continuously expanding library of 250+ pre-built expertise-based automation assessments ready to use right out of the box or customize as needed without code. These automation units address the most common scenarios seen in most enterprises for an event-driven response, such as those reported via a network helpdesk service ticket), as well as for proactive design-level compliance, security, and application performance support verifications.

09
Intuitive Dashboards
Customizable intent dashboards provide crucial automation and diagnostic summaries in a single GUI. Create from intents on the fly to view results for a specific problem or a network change to analyze user activity, tasks, and incident status. Dashboards allow managers to look at thousands of network intents in a single place to glean what’s important and see network automation trends.

10
Multi-Vendor
Empowers enterprises by capturing their existing multi-vendor mix of physical, virtual, software-defined, and cloud technologies and network operation’s best practices and allows them to be visualized, diagnosed, and automated at scale.
